DBB Desktop reads every ride and every charge in order and learns what normal looks like for your electric motorcycle or custom EV. When one cell starts to drift, it names the cell, says how far it has moved since the pack was new, and shows how fast it's changing. It's your private data, on your computer.
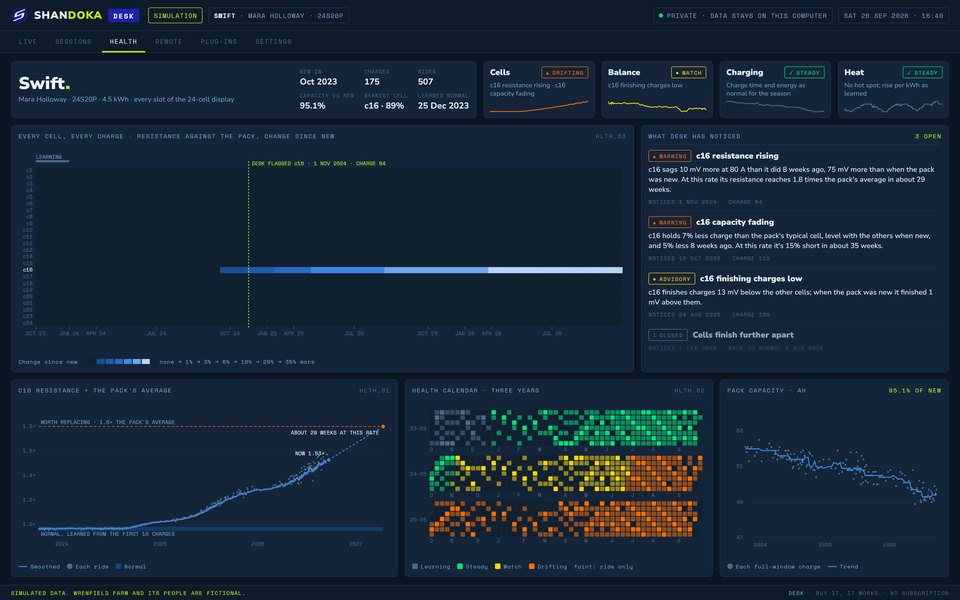
Every screen on this page comes from a simulation of DBB Desktop. We generated three years of one motorcycle pack, 175 charges and 507 rides, made one cell group age faster from charge 50, and ran the whole history through Desktop's health model. The bike, Swift, and its rider are fictional.
Every pack has its own character: how far each cell sags under load, how long a charge takes, how warm it runs. Desktop spends the first ten charges learning that. After that, every session is measured against the pack's own normal.
Four cards sum up the pack: cells, balance, charging and heat. Each one is learning, steady, on watch or drifting, with a sparkline of the reading behind it.

The drift map gives each cell a row and each charge a column, shaded by how much that cell's resistance has grown against the rest of the pack since it was new. A healthy pack stays dark. Swift's c16 lights up from the middle of 2024 and gets brighter every season.
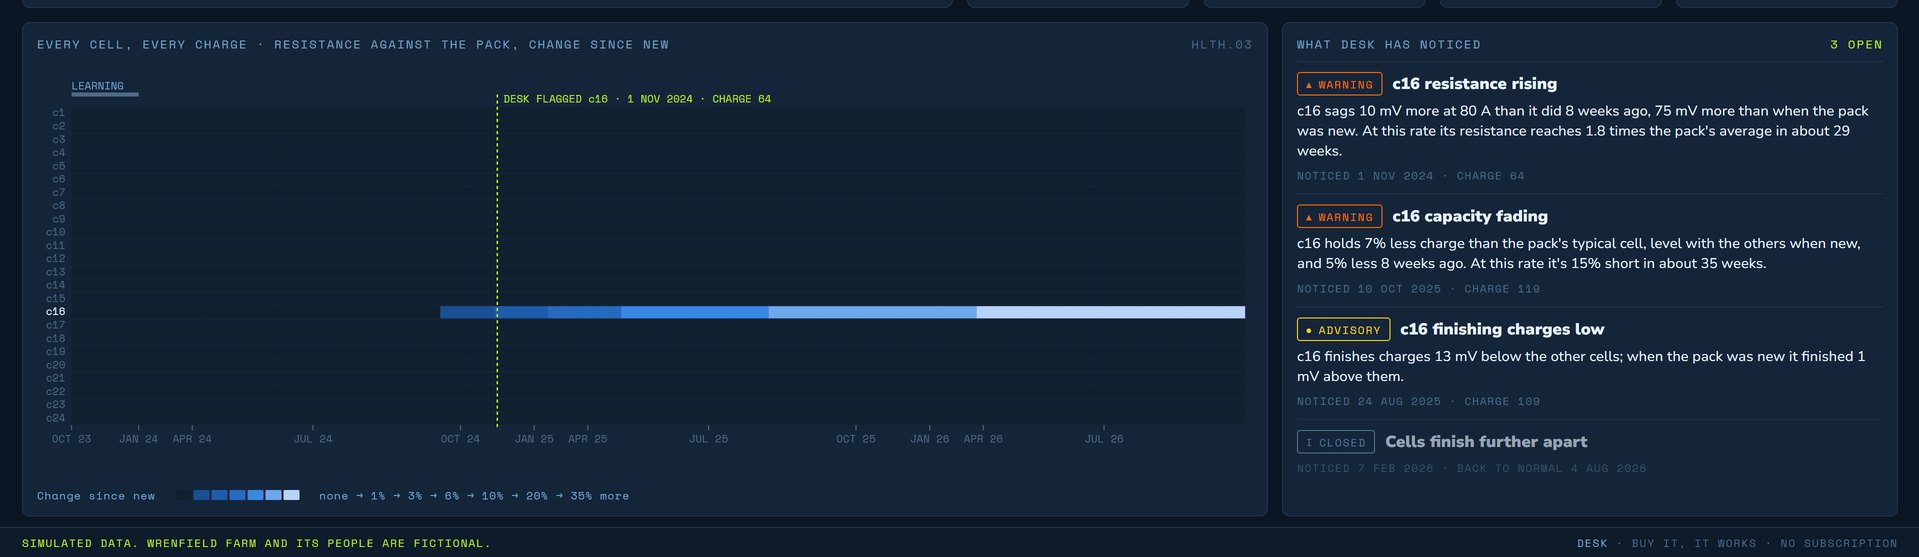
Desktop raises a finding when a reading moves away from normal and keeps moving. It holds the finding until the change is clear, and closes it if the reading comes back.
No other cell raised anything in three years.
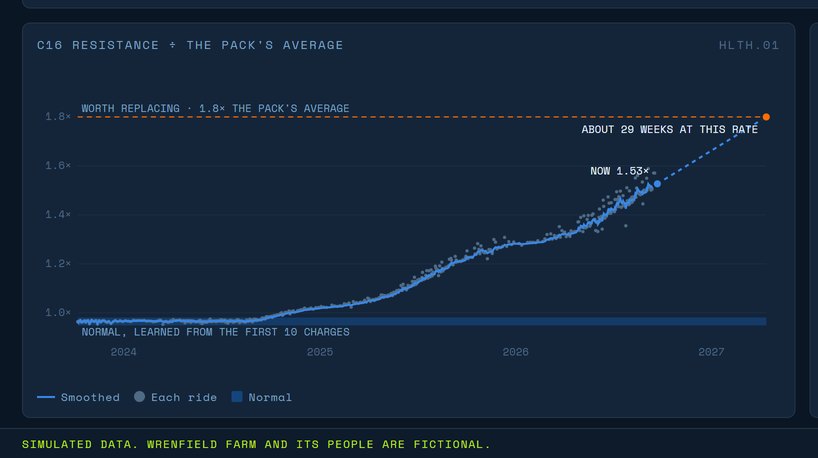
A finding comes with its rate. Today c16 sags 75 mV more at 80 A than when the pack was new, and at this rate its resistance reaches 1.8 times the pack's average in about 29 weeks.
That's the point where replacing the cell group is worth doing, so the job can be planned for a winter weekend.
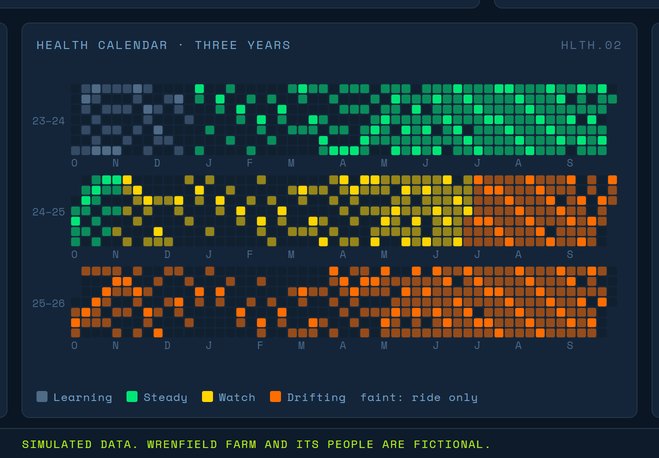
The health calendar gives every day of the pack's life a square, colored by what Desktop made of that day's sessions. You can see the first months of learning, the long steady run, and the season c16 started to drift.
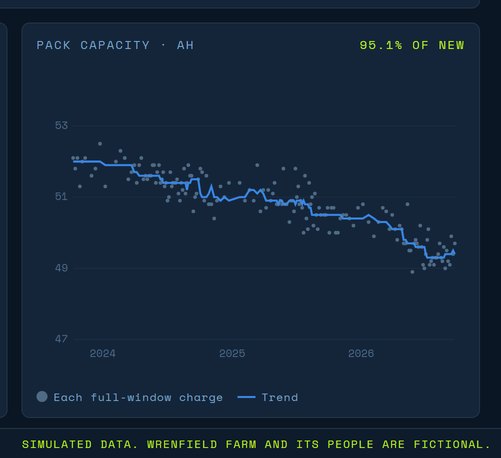
Beside it is pack capacity from every charge that covered enough of the pack to measure it: 95.1 % of new after three years, with the trend drawn through the readings.
Print the pack's history on one page: capacity over time, resistance per cell, the weakest cell's record and any service. It's what a buyer of a used EV would want to see, and what a shop needs before it opens the pack.
With a DBB on the bike, every ride and charge comes across to Desktop and joins the history. At the bench, Desktop records its own sessions from the BMS and charger.
The history lives on your computer, and what Desktop learns about your pack comes from your own sessions.
Desktop tells you which cell is changing, by how much and how fast. It doesn't predict failures or replace the BMS, and what to do about a pack stays with you and your technician.
It's how much of its original capability a pack still has, measured as capacity against new and as internal resistance. DBB Desktop tracks both for the whole pack and for every cell.
It compares each cell with the rest of the pack at the same moment and under the same load, and with its own readings from when the pack was new. A cell that sags more, holds less or finishes a charge lower than it used to shows up as a trend before it trips a cutoff.
Yes. It learns normal from the first ten charges you record and measures every change from there.
No. Desktop runs on its own at the bench. With a DBB on the bike as well, your rides and charges from the road join the history.
The same ones the DBB reads: many popular BMS, charge management and EV drive systems, with more integrations being finalized.
No. Buy DBB Desktop and it works.
Everyone on the waitlist saves $99, whichever DBB they choose: an early-release tester unit now, or DBB Lite, Full, Pro or Desktop when they're released. Tell us about your pack and how you'd use Desktop.
